How Data Analytics is Reshaping M&A and Due Diligence

Diana Marie Peralta

Senior Manager, Data Analytics and ERP Implementation Services

How Data Analytics is Reshaping M&A and Due Diligence

Today, the stakes for M&A are higher than ever, and so is the amount of data involved in every deal. In the past, due diligence often meant combing through financial reports and working with spreadsheets by hand. But with the amount and complexity of business data today, that approach is no longer enough.


This is where data analytics plays a critical role. It gives deal teams the ability to move faster, uncover risks and opportunities, and make more informed decisions. In fact, Deloitte reports that around 97% of corporate and private equity leaders are now using advanced analytics or AI to strengthen their approach to due diligence and M&A decision-making.


With that in mind, let’s explore how data analytics is reshaping M&A due diligence and why it’s becoming a necessity for companies that want to gain an edge in a competitive market.


The Role Due Diligence Plays in M&A

Due diligence is the foundation of every M&A deal. It provides buyers with the insights they need to make sound decisions and helps reduce the chances of costly surprises after the transaction closes. At its core, due diligence assesses the financial health, operational performance, legal risks, and market position of the company being acquired.


What’s changing is how this work gets done. Instead of relying solely on manual data gathering and spreadsheet analysis, deal teams are now turning to advanced analytics to dig deeper and cover more ground in less time. For dealmakers, analytics is no longer a “nice to have” but has become an essential part of the process.


This shift is happening for a good reason. EY’s 2024 Technology Corporate Development Survey found that almost two thirds of acquisitions don’t meet most of their pre-deal KPI goals. This reinforces the need for stronger, data-driven diligence that can flag risks earlier and help buyers set more realistic expectations about the value they can capture from a deal.


Data Analytics and Due Diligence

Data analytics can enhance due diligence through its use of advanced tools and techniques making analyses much faster and more efficient.


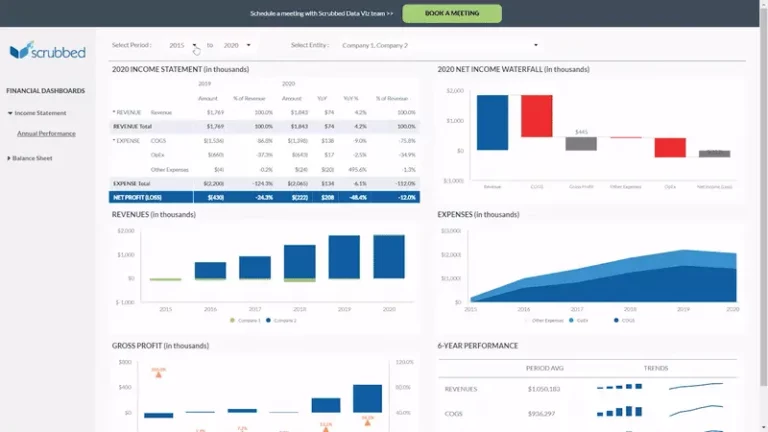
  • Data Visualization – Through the use of dynamic dashboards, it can present the data in various charts and graphs e.g. trend analysis to help uncover irregularities in revenue streams, expenses, or detect potential areas of financial risk. It can also calculate metrics much faster such as those related to profitability at a customer level or product level, allowing decision makers to gain a clearer picture of the target company’s performance drivers.

    For instance, a dashboard might show revenue by customer segment in a line chart, while a heat map can highlight expense categories with unusual spikes to make anomalies more visible.
    Data viz gif 768x432
  • Automation – Due diligence usually has tight deadlines and volumes of data can come from disparate sources. Data analytics tools can definitely make the data cleansing, aggregation, and reconciliation much faster and more accurate.

Leverage Scrubbed’s Data & Analytics Services

This is where Scrubbed can make a meaningful difference. We help deal teams unlock the full potential of data analytics while ensuring every insight is grounded in accounting and financial expertise.


Here’s how we support M&A and due diligence:


  • Data preparation and optimization to make sure information is accurate, complete, and ready for analysis.
  • Advanced financial analysis that uncovers irregularities, highlights risks, and identifies opportunities for value creation.
  • Custom dashboards and reporting that make it easy to track key metrics, synergies, and trends throughout the deal.
  • Sales, marketing, and inventory analytics to give a clearer picture of business performance and growth potential.
  • Human resources analytics to assess workforce efficiency, cost structures, and potential integration challenges.
  • Automated reporting to streamline recurring reports and free up teams for higher-level decision-making.
  • Post-merger integration support, including aligning financial systems, reporting processes, and compliance requirements.

By combining advanced analytics tools with CPA expertise, Scrubbed helps companies move faster, minimize risks, and make smarter decisions at every stage of the deal lifecycle.


Conclusion

For companies pursuing M&A now, relying only on traditional due diligence methods isn’t enough. The amount and complexity of data involved require a more advanced approach. Data analytics can give deal teams the speed and insight needed to uncover risks, spot opportunities, and make better decisions that increase the chances of long-term success.


But data analytics alone is not the answer. Its real value comes from combining analytics with the experience and judgment needed to interpret them and turn them into action. That’s why more companies are turning to trusted partners like Scrubbed.


If your company is planning an acquisition or preparing for a transaction, this is the time to strengthen your due diligence process with data-driven insights. Connect with Scrubbed today to explore how we can help you navigate M&A with confidence and clarity.


How Scrubbed Can Help

If you are interested in expanding into this area but your team lacks the time or expertise to manage complex ESG requirements, outsourced accounting can be a powerful solution. Our CPA-focused services provide specialized knowledge and up-to-date training that you want to offer clients in a scalable and cost-effective way. Scrubbed’s outsourced ESG accounting services can help you expand your client service offerings, including implementing internal controls, green energy tax advisory, sustainability preparedness, and reporting.

CONTACT
How Scrubbed Can Help

Related Content

Blogs

How Data Visualization Empowers Decision Makers

How Data Visualization Empowers Decision Makers

What is your financial data telling you?For many organizations, the answer isn’t very clear. Despite the fact that big data is big business—with the data industry anticipated to approach $77 billion by 2023—companies often find it challenging and overwhelming to make sense of huge volumes of complex financial data gleaned from multiple sources.For many, data visualization is the key to turning financial reports into actionable, decision-making tools that drive value and enable long-term growth and profitability.A Picture Tells a Thousand Words Data visualization is a graphical representation of data—using charts, diagrams, maps, and other visual elements that go beyond presenting the numbers to telling a story. The objective of data visualization is to help the business spot trends, patterns, exceptions, and opportunities more easily, then make informed business decisions based on actionable insights.     While it’s useful for a variety of industries and functions, data visualization is especially helpful for transforming the value and effectiveness of financial reporting. It allows decision makers across the organization to interpret and understand large quantities of financial data more quickly and accurately, which leads to better decision making that can propel the business’ growth and success.  At its core, data visualization is a story-telling device. It turns numbers and facts into visual stories that empower both financial and non-financial users to make key business decisions, without wading through complicated and confusing spreadsheets with endless columns of figures. Given that about 65 percent of people are visual learners, enabling employees across the workforce examine, understand, interpret, and apply financial data more effectively in their respective functions can prove to be a significant competitive advantage.Tailoring Data to Your AudienceWhenever you’re presenting information, it’s always vital to keep your audience in mind. That’s especially true with financial data. Who will be digesting this information? What is their skill and knowledge level when it comes to financial data?The beauty of data visualization is that it allows you to customize the graphical presentation of data to the needs of different audiences within the company, ensuring each function has the information needed to make the best decisions. Rather than share traditional, one-size-fits-all financial reports that can be difficult for non-financial users to understand and interpret, the finance team can develop data visualizations that are tailored and meaningful for each group.  For example, the sales staff might benefit from visual dashboards that show how sales are trending in their territory or region, how sales of a particular product compare to the previous year, or whether certain customer segments are exhibiting a noticeable change in buying patterns or other behavior. The manufacturing team will want to see a completely different story, focused on understanding how inventory levels are trending by product or whether product returns are up or down.Another benefit to using data visualization for financial reporting is the ability to integrate data from multiple sources and platforms across an organization or industry. Access to contextualized information can help the business spot trends, issues, and opportunities that aren’t readily apparent when looking at data from a single source—then connect the dots, draw conclusions, and determine what to do in response.Putting Data Visualization to WorkThere are two primary types of data visualization, and both can help turn your financial reporting into more actionable insights.Exploratory data visualization digs into the numbers in an effort to understand the “what, when, why, and how” behind the data. It enables the users to drill down across periods of data, different levels of granularity, or through different categories. It’s like having a ready and flexible analytical tool that you can navigate right at your fingertips.Explanatory data visualization is more straightforward and focuses on sharing the important data points to tell a story. It can summarize and highlight key insights that can be shared especially during higher levels of discussions among key business decision makers such as the management or the board of directors. It’s about presenting the data you’ve determined is most essential to share.    Both exploratory and explanatory data visualization are useful in financial reporting and analyses because they enable the company to understand what is driving the data, share useful insights across the organization, and make decisions on how to best allocate resources, address problems, or capitalize on opportunities. Both forms of data visualization also can help you zero in on the metrics that matter most to your business, ensuring that your teams stay focused on the performance measures that are most meaningful to your organization.   Getting Started with Data VisualizationData visualization is quickly shifting from a nice-to-have to a must-have capability for organizations that are eager to turn their financial reporting into a powerful decision-making tool. But with so many data visualization technologies and tools available, how can your business best leverage this capability to transform your financial reporting?Teaming up with a partner that’s highly experienced in using data visualization for financial reporting is a great first step. Scrubbed provides financial reporting that incorporates state-of-the-art data visualization, helping our clients make the most informed business decisions based on actionable insights. We also offer free consultation on financial reporting, as well as accounting, corporate finance, nonprofit financial reporting, tax compliance, technical accounting support, and other professional financial services.Watch this!If you’re ready to turn your financial reporting into a powerful decision-making tool using data visualization, contact the financial reporting experts at Scrubbed at [email protected] or 800-837-5160.

Read More >
Blogs

Turning Data into Dollars: Insights from Our Marketing ROI Webinar with Scrubbed & ClicData

Turning Data into Dollars: Insights from Our Marketing ROI Webinar with Scrubbed & ClicData

We understand the challenges marketing agencies face in translating complex data into clear, actionable insights for clients. We recently co-hosted a webinar with ClicData to tackle this very issue. Titled “Proving Your Marketing Agency ROI to Clients on Demand,” this session provided a roadmap for automating marketing ROI measurement and unlocking powerful client communication strategies.The Challenge: Speaking the Language of ResultsBuilding strong relationships with marketing agencies hinges on clear communication and demonstrable results. Yet, many agencies struggle to present data in a way that resonates with clients focused on bottom-line impact. Traditional reporting methods can feel static and leave clients questioning the true value of their marketing investments.The Power of Data VisualizationDuring the webinar, we highlighted the transformative power of data visualization tools like ClicData. Diana Peralta, Senior Data and Analytics Manager at Scrubbed, worked with marketing experts from ClicData to showcase how these tools can revolutionize client communication.Imagine interactive dashboards that seamlessly integrate data from various platforms like Google Analytics, HubSpot, and social media. These visual representations provide a holistic view of marketing performance, allowing you to tell a compelling story about the impact of your client’s marketing efforts.Benefits for Agencies:By partnering with Scrubbed and ClicData, you can elevate your reporting capabilities and empower your clients with:Time Efficiency: Automate data collection and reporting, freeing up your team to focus on developing high-impact marketing strategies.Customization: Design custom-branded dashboards tailored to each client’s specific needs and metrics, fostering deeper engagement.Real-Time Insights: Clients gain access to constantly updated data, enabling them to make data-driven decisions and optimize campaigns in real-time.Comprehensive Reporting: Integrated dashboards provide a clear picture of marketing ROI across various channels, demonstrating the value you bring to your clients.A Collaboration that Drives SuccessJen Marino, Chief Growth and Marketing Officer at Marketri, highlighted a successful case study that leveraged data visualization tools to significantly improve client interactions. By presenting clear, actionable insights, Marketri not only strengthened client relationships but also effectively communicated their true marketing value, leading to increased client satisfaction and retention.The Final Word: Building Trust Through TransparencyIn today’s data-driven world, transparency is key to building trust with clients. Partnering with Scrubbed and ClicData equips you with the tools to translate complex data into a clear and compelling narrative. Whether you’re measuring marketing ROI or navigating the intricacies of financial reporting, our expertise including biotech accounting services and fractional CFO services, ensures that your data tells a story that resonates with stakeholders and strengthens client partnerships.Ready to unlock the power of data visualization and elevate your marketing ROI reporting?  Watch the on-demand webinar : “Proving Your Marketing Agency ROI to Clients.” Let’s work together to transform data into tangible results for your clients.

Read More >
Blogs

The Alignment Reality: Why We Stopped Treating Marketing and Sales as Separate Functions

The Alignment Reality: Why We Stopped Treating Marketing and Sales as Separate Functions

At A GlanceTreating marketing and sales as separate functions with distinct KPIs creates structural leaks in the modern buyer’s journey. Aligning these teams requires more than just shared meetings; it requires a single source of truth in your data and a unified focus on top-line revenue. When revenue is the shared goal, departmental friction dissipates, trust in the process increases, and the business is positioned to scale sustainably.When my role at Scrubbed transitioned from CMO to Chief Growth Officer a little over a year ago, it gave me a completely new vantage point on the gaps in our funnel.In marketing, we were hosting highly successful webinars. We had built this massive database of warm leads. But as I started looking at the entire buyer’s journey across both teams, I realized these prospects were just sitting there, marinating. They weren’t moving over to sales fast enough.It wasn’t because marketing was generating bad leads, and it wasn’t because sales couldn’t close. It was a structural issue. We were operating like almost every other growing company: we had two different leaders running two different teams with two different sets of KPIs.When you manage a team based on how many MQLs they generate or how many meetings they book, natural silos form. At the end of the quarter, if revenue is down, human nature kicks in. Marketing says, “We sent you the leads.” Sales says, “The leads were garbage.”We realized that if we wanted to scale sustainably, we had to stop managing departmental metrics and start managing the actual buyer’s journey.The Reality of the Modern FunnelThe truth is, the buyer’s journey is no longer a straight line. It is not a clean handoff where marketing educates a prospect and neatly passes them to sales to close the deal.As HubSpot has pointed out, it’s a loop. Buyers have endless access to information. They might attend a webinar, read an article, pause for three months because their day job gets busy, and then suddenly re-engage. At any given time, only about 5% of your market is actually ready to buy.When marketing and sales operate in silos, you create massive leaks in that loop. Someone attends an event, they learn about your brand, and then…nothing happens. Nobody from marketing or sales systematically reaches out to bridge that gap over the long term.Aligning the EngineIn bringing both disciplines under one umbrella, the goal wasn’t to force salespeople and marketers to act like the same people. It was to give everyone a single, unifying target: top-line revenue growth.When revenue is the only goal that matters, the friction dissipates. It’s no longer, “Yay marketing, you brought in MQLs” if we didn’t hit our revenue goal. Suddenly, the sales team starts reaching across the aisle to ask marketing for sharper presentation decks, knowing that better collateral helps them close. Marketing gladly puts down what they’re doing to help, because they want the win just as much.But to make this work, we had to get our hands dirty with the data. You cannot align teams without aligning their source of truth. We had to sit down and clearly define what a lead actually was, what an MQL was, and what gets passed over. We put specific people in charge of our CRM on both the marketing and BD sides. Now, when we run our KPI reports, there are checks and balances. As a CGO, I can look at the numbers with a high degree of confidence and glean actual insights, rather than worrying if the data is tagged correctly.The Results of Shared OwnershipWe saw the reality of this alignment during our recent “The Future is Fractional” event. It was a 4-hour virtual event, which was a massive lift for the marketing team to build.But it wasn’t just a marketing initiative. The business development team also tapped into its referral sources. They brought key customers to the table. And most importantly, they had follow-ups teed up and ready to go for the 300+ people who registered. It was a shared lift, and because the handoff was structurally sound, we managed to drive actual ROI.When leaders ask me for advice on aligning these historically siloed teams, I tell them to avoid the trap of trying to make them one homogeneous group. Marketing and business development still have very specific, different roles to play.You don’t need to force the teams to meet every single week or blend their daily tasks. Growth doesn’t happen because you forced two teams into the same room. It happens because you built an environment where they trust each other’s processes, share a single source of truth, and take shared ownership of the outcome.Key TakeawaysSiloed metrics create friction: Managing teams by separate departmental KPIs (like MQLs vs. meetings booked) builds natural walls between marketing and sales.The funnel is a loop: The modern buyer’s journey is continuous and self-directed, requiring systematic, long-term follow-through rather than a single, clean handoff.Revenue is the ultimate aligner: Giving both disciplines a single, unifying target of top-line revenue growth eliminates finger-pointing.Data is the foundation of trust: You cannot align teams without aligning their source of truth; defining shared metrics and accountability within the CRM is critical.Alignment is not homogenization: Teams do not need to blend their daily tasks. Growth happens when distinct teams trust each other’s processes and take shared ownership of the outcome.

Read More >

Contact Information

SF Bay Area Headquarters
111 Anza Boulevard, Suite 320, Burlingame, CA 94010, United States

Phone: (800)837-5160
Email: [email protected]

"Scrubbed" is the brand name under which Scrubbed Advisory, LLC and Scrubbed Assurance LLP provide professional services. Scrubbed Advisory, LLC and Scrubbed Assurance LLP practice in an alternative practice structure in accordance with the AICPA Code of Professional Conduct and applicable law, regulations, and professional standards. Scrubbed Assurance LLP is a licensed independent CPA firm that provides attest services to its clients, and Scrubbed Advisory, LLC provides tax, finance, and support services to its clients. Scrubbed Advisory, LLC is not a licensed CPA firm.

Copyright © Scrubbed. All rights reserved.