

Stockouts, also known as out-of-stocks, are a big problem for retailers that leads to lost sales, angry customers, damaged branding, and increased operational costs. It’s a terrible situation for a retailer to be in as they can lose to a competitor. It’s not a unique problem just for some retailers. In fact, stockouts cost $684 billion every year worldwide according to the IHL Research Group. Retailers don’t need to look too far to know that there is an opportunity to increase sales year-over-year when this issue is addressed. In this part one of a two-part blog series, we’ll look into tips on how retail managers can get a clearer picture of their company’s out-of-stock problem.
1. Use an Inventory Management Software
In order to form a picture of the current out-of-stock issues, it is imperative to look at inventory transaction data such as purchase orders, sales orders, assemblies, and fulfillment. It would be close to impossible to quantify and fully describe the company’s stockout problem without recorded data. Customer complaints, store and warehouse inspections, and consequent verbal reports can only show a fraction of the entire problem. Checking recorded transactions can verify such claims and help discover bigger encompassing issues such as internal process failures, personnel problems and disconnected data that contribute to stockouts.
Using inventory management software such as DEAR records inventory transactions on the cloud and generates reports for further analysis. With an easily accessible database of these transactions, it would be easier to describe and specify the cause of stockouts especially when paired with strategic oversight from fractional CFO services that can provide guidance on aligning inventory processes with broader financial goals.
2. Generate an ABC Analysis Report
The ABC Analysis report is based on the Pareto Principle to identify the worst and best performing inventory. With the data stored in the inventory management software, it is now possible to identify the 20% of inventory that contribute 80% to a chosen metric, whether it be cost of goods sold, revenue or profit. For the following example, the cost of goods sold is used.
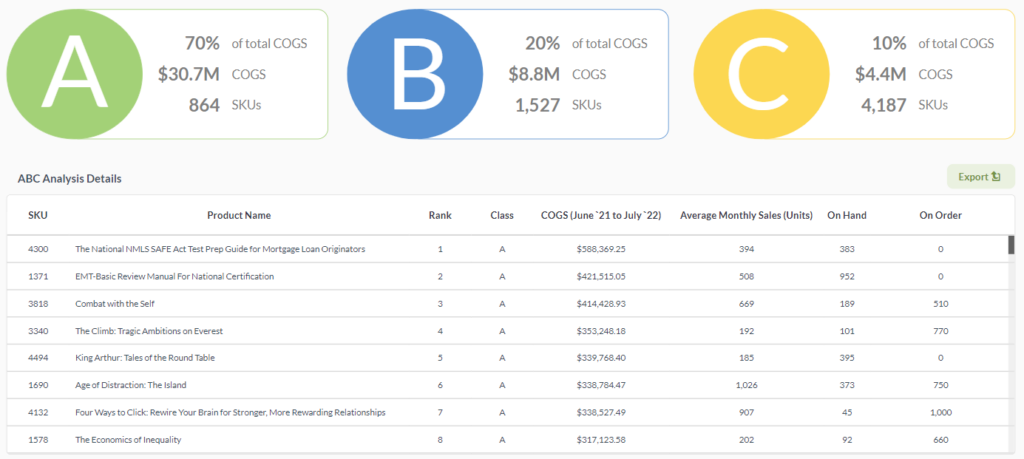
For a chosen date period, the products are ranked from 1 to n according to COGS. Calculate the percentage of each product’s contribution to the total COGS. The products that contribute 80% of the total COGS are classified as “A”; the next 15% are classified as “B”; and the last 5% are classified as “C”. It is also possible to use other percentage combinations such as 70%, 20% and 10%. The goal is to identify what Joseph Juran calls the “vital few and the trivial many”.
3. Include Other Data with the ABC Analysis
Since “A” products should be given priority, what other information about these products are important for the organization to know? Will the current stock suffice for the demand? Are there still enough quantities on order with the lead time considered? How many days before the stock sells out? For each product, such questions can be answered by merging the ABC Analysis report with other data such as on hand, on order, and average monthly sales. Other information from other reports that will ease in the product’s monitoring are encouraged to be merged in.
The ABC Analysis report then becomes dynamic and could be used to check the most important information of your most important products. In a meeting, everyone looks at only one report and can decide together on issues that arise while going through the list.
Need help on inventory management and analysis? Book a consultation with us!
ABOUT THE AUTHOR: Francis has over six years of combined experience analyzing data, building, and managing dashboards for inventory, sales, and marketing. He is currently helping with inventory management for retail companies in the US.