

Speed is key to a successful retail business, whether you’re brick-and-mortar or online. If you react too slowly, you can end up with unnecessary holding costs for excess stock or stockouts that cause you to miss out on sales and hurt your reputation. As a retail leader, it’s crucial to precisely track inventory to minimize waste and understand the financial impact of your decisions in real time. With so much going on, staying competitive means having accurate and up-to-date information.
Data visualization insights
In today’s fiercely competitive retail environment, having instant access to data on sales, inventory, and other financial KPIs is crucial. And that goes double for eCommerce.
At Scrubbed, we recognize the vital role data plays in your business. That’s why our team of data visualization experts has designed easy-to-use dashboards that provide both quick overviews and in-depth insights into your financial, sales, and inventory situation. With our user-friendly tools and SaaS accounting expertise, you’ll have the power to make informed decisions that drive success for your business. So, you can stay ahead of the competition and take your retail business to the next level.
How our data visualization dashboards unlock the potential of your data
Our data visualization dashboards are not just any tool; they’re the backbone of your business strategy. With user-friendly interfaces and visually engaging graphics, you can quickly and easily monitor your business’s performance and identify areas for growth and improvement. The dashboards give you an inclusive view of your most critical data, from financial KPIs to sales trends and inventory insights.
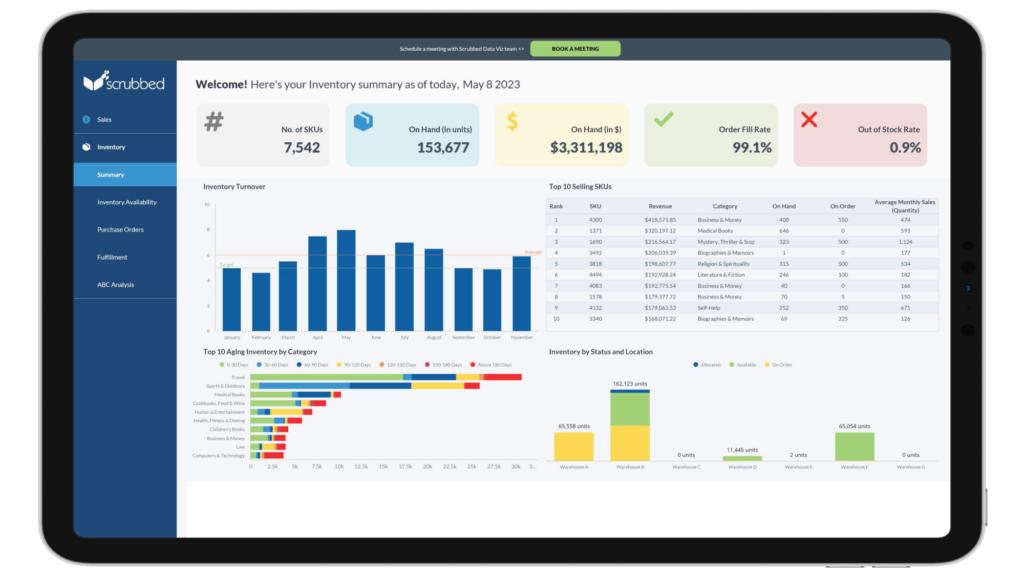
Inventory summary
The inventory-focused dashboard provides visibility into critical information, including:- Top selling and most profitable SKUs
- On–hand units by quantity and dollar amounts
- Aging inventory by category
- Order fill and out-of-stock rates
- Inventory by status and location
You can quickly drill down into more in-depth visualization of inventory availability, purchase orders and fulfillment status, and even ABC analysis to instantly identify your best and worst performing SKUs.
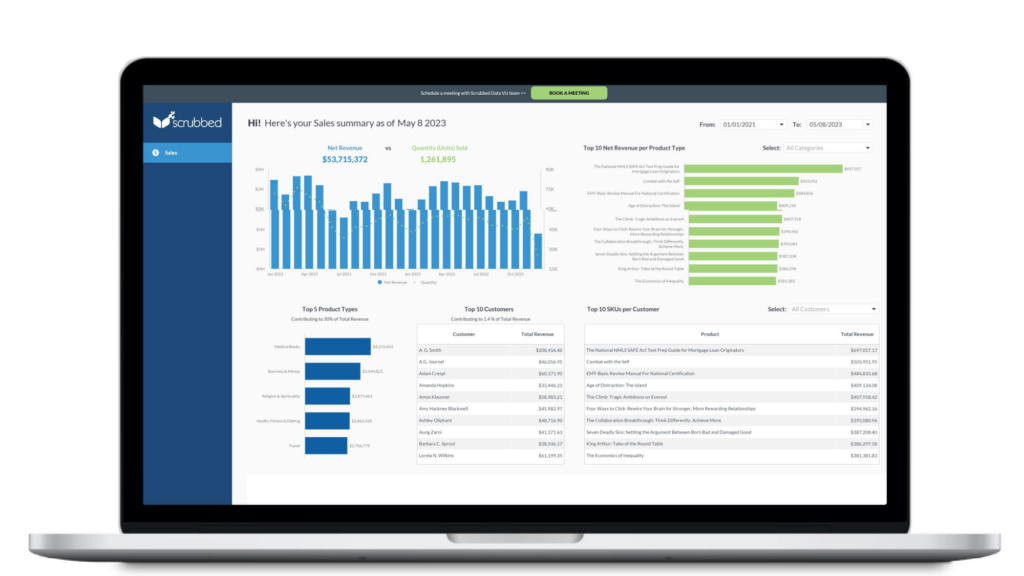
Sales dashboards
Visualizing the data generated by sales means up-to-the-minute insight into essential business drivers, including:
- Net revenue vs. units sold
- Breakdowns of revenue by product, customer, and geographic locations
- Performance of product types and individual products
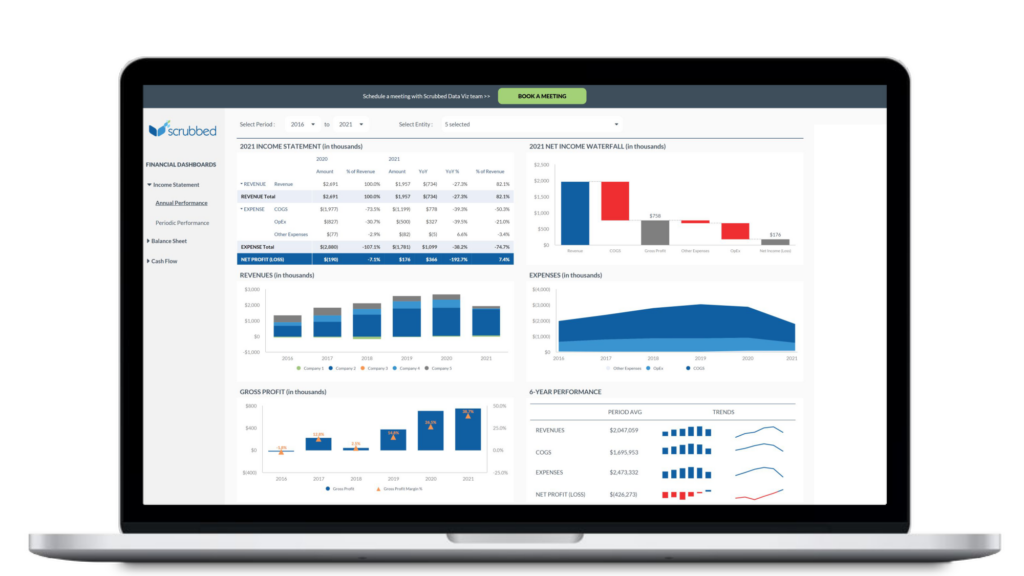
Financial dashboards
Tailored financial visualizations cover key business data that monitor the health, stability, and growth of your retail or eCommerce business, including:
• Income Statement Analysis: annual or periodic business performance showing analyses of revenues, expenses, and income,
• Balance Sheet Summary: showing snapshot of your current financial position with key ratios such as current ratio, debt to equity ratio, return on assets, and return on equity
• Cash Flow Analysis: key metrics including cash inflow/ outflow, cash runway, cash balance, and cash conversion cycle related metrics
How to make the most of data visualization dashboards
We designed our dashboards to be both beautiful and easy to use, and they’re the key to increased efficiency and better decision-making:
• Quickly identify trends and patterns: It’s much easier to spot and share emerging trends with data visualization.
• Make informed decisions: Data visualization makes it easy for managers to understand complex data and make informed decisions based on that data. Visualizations help you identify opportunities to increase sales or the need to adjust inventory levels.
• Monitor performance: Track performance in real-time and make adjustments as needed. The Scrubbed dashboards make monitoring key performance indicators (KPIs) such as revenue, profit margins, and inventory turnover easy and timely.
• Improve communication: Data visualization helps everyone speak the same language and easily understand opportunities and challenges.
• Save time: By automating data analysis and report generation, managers are freed up to focus on making decisions and taking action rather than gathering and preparing reports.
Are you ready to take the next step with data visualization for your eCommerce or Retail business? Schedule a meeting with Scrubbed Data Viz Team to see how our insights and fractional CFO services can drive smarter financial decisions.